Translate this page into:
Clinical Profile of Diabetic Nephropathy and its Correlation with Neutrophil-Lymphocyte Ratio in Type 2 Diabetes Mellitus
*Corresponding author: Madhuri Holay, Department of Medicine, Government Medical College, Nagpur, Maharashtra, India. mpholay@gmail.com
-
Received: ,
Accepted: ,
How to cite this article: Murughesh ME, Holay M, Patil P, Tayade P. Clinical profile of diabetic nephropathy and its correlation with neutrophil-lymphocyte ratio in type 2 diabetes mellitus. Vidarbha J Intern Med 2022;32:108-14.
Abstract
Objectives:
Diabetic nephropathy (DN) is a microvascular complication of diabetes. It manifests clinically as albuminuria which is the precursor of end-stage renal failure. This is considered to be an inflammatory process. In recent past, it has been reported that the neutrophil-lymphocyte ratio (NLR) may be a favourable indicator of the inflammatory status. It is cost effective and easily accessible marker. The present research was undertaken to study the clinical profile of DN and to see the association between NLR and DN in patients with type 2 diabetes mellitus (DM).
Material and Methods:
A total of 210 patients were enrolled, of them 105 healthy individuals without diabetes were taken as controls and cases were 105 subjects with type 2 diabetes. Patients were, further, divided based on urine albumin creatinine ratio (UACR) into DM without nephropathy (UACR <30 mg/g) group and DM with nephropathy (UACR >30 mg/g) group. For intragroup comparison, DM with nephropathy group was, further, divided into microalbuminuria (UACR 30–300 mg/g) and macroalbuminuria (UACR >300 mg/g).
Results:
NLR was found significantly increased (P < 0.0001) in patients with DN (2.81 ± 0.51) as compared with DM without nephropathy (2.12 ± 0.64) and healthy adults (2.06 ± 0.29). However, NLR value was unable to differentiate between patients with microalbuminuria and macroalbuminuria. There was a significant correlation between NLR and DN in type 2 diabetes while there was no statistically significant difference in distribution of NLR in different stages of chronic kidney disease.
Conclusion:
NLR can be used as a novel biomarker of DN in patients with type 2 DM.
Keywords
Diabetic nephropathy
Neutrophil-lymphocyte ratio
Type 2 diabetes mellitus

INTRODUCTION
Type 2 diabetes mellitus (DM) is one of the most common health problems facing the humankind. Diabetes is a systemic disease having serious microvascular and macrovascular complications. Microvascular complications include diabetic nephropathy (DN), retinopathy and neuropathy while the macrovascular complication includes stroke, cardiovascular diseases and peripheral vascular diseases. Diabetes and its complications account for nearly 1.2 million deaths in South-East Asia region alone.[1,2]
At present, DN is the most common cause of end-stage renal disease (ESRD). It is clinically manifested as increased albuminuria starting from microalbuminuria to overt proteinuria and eventually ESRD.[3] Its diagnosis in incipient stages may allow prompt interventions and improved prognosis. Towards this aim, many biomarkers for detecting early DN are being studied. Microalbuminuria has been a proven and remarkably useful biomarker for diagnosis of DN and assessing its associated condition mainly – cardiovascular ones and for monitoring its progression. New research has pointed out that some of the biomarkers such as glomerular, tubular, inflammatory markers and markers of oxidative stress often precede the development of albuminuria in some patients.[4]
Several studies that have explored the relationship between systemic inflammation and vascular disease indicate that chronic inflammation promotes the development and acceleration of micro- and macro-angiopathic complications in patients with diabetes. Total leucocyte count (TLC) is a crude but sensitive indicator of inflammation[5] which can be easily done in laboratory routinely. Increase in the neutrophil count is seen in thrombus formation and ischaemic diseases. The neutrophil-lymphocyte ratio (NLR) in complete blood count (CBC) is studied in many cardiac and non-cardiac diseases as an inflammatory marker and is used to predict the prognosis of diseases such as myocardial infarction,[6] stroke and heart failure.[7] DN in type 2 diabetes has an inflammatory pathology.[5,8] Many inflammatory markers have been found to be related to DN, such as interleukin-1 (IL-1), IL-6, IL-8, transforming growth factor-β, tumour necrosis factor-α and cytokines.[9,10] However, their measurement is not used routinely. In this respect, NLR has emerged as a novel surrogate marker. Given the expected growth in the diabetic population in India and scarcity of Indian data, it is important to study the relationship between NLR and DN. Hence, the present study was undertaken.
MATERIAL AND METHODS
After obtaining Institutional Ethics Committee approval and written informed consent from all the patients, this cross-sectional observational study was conducted in the department of general medicine at a tertiary care centre in Central India for 2 years from November 2018 to October 2020. A total of 210 individuals were enrolled of them 105 were diagnosed cases of type 2 DM as per ADA diagnostic criteria[11] while 105 healthy age- and gender-matched individuals without diabetes and those willing to give written informed consent were taken as controls for NLR values. Patients with type 1 DM and also patients of type 2 DM with critical illness, acute myocardial infarction, fever – urinary tract infection, respiratory tract infection, infectious focus, chronic liver disease, stroke malignancy and autoimmune disorder were excluded from the study.
All the subjects were interviewed with predesigned questionnaire for detailed history and were followed by clinical examination, routine blood investigations and urine analysis. CBCs were measured. Using the absolute neutrophil count (ANC) and absolute lymphocyte count (ALC) from the CBC, NLR was calculated. A spot urine sample was collected from all the subjects in the study. Urine albumin and urine creatinine were measured and ratio was calculated manually. Diabetic subjects with urine albumin creatinine ratio (UACR) >30 mg/g were taken as DN group and <30 mg/g as without nephropathy group. For intragroup analysis, DN group was divided further into microalbuminuria (UACR 30–300 mg/g) and macroalbuminuria based on UACR (UACR >300 mg/g). The other blood chemistry panels were done (blood glucose, blood urea, serum creatinine, serum lipids and LFT). All the study groups were compared for various variables with special reference to NLR and albuminuria.
Statistical analysis
Continuous variables were presented as mean ± SD. Categorical variables were expressed in frequency and percentages. Categorical variables were compared by performing Chi-square test. P < 0.05 was considered as statistically significant. Statistical software STATA version 14.0 was used for data analysis.
RESULTS
A total of 210 individuals were enrolled in the study, out of them 105 healthy individuals without DM were taken as controls for NLR values and cases were 105 subjects of type 2 DM which were included as cases, which were, further, divided on the basis of albuminuria using UACR into microalbuminuria and macroalbuminuria [Figure 1].

- Distribution of study population in different groups (n=210).
The maximum numbers of diabetic subjects were in the age group of 51–60 years ranging from 35 to 75 years. The mean age among the healthy control group was 47.09 ± 10.89 years while among DM without nephropathy group was 50 ± 8.53 years, DM with nephropathy-microalbuminuria group was 48.53 ± 8.31 years and DM with nephropathymacroalbuminuria group was 54.61 ± 8.99 years. Male-to-female ratio in our study subjects was 3:2.
Demographic data and other parameters in different groups were analysed [Table 1].
| Demographic data | Healthy control, n=105 | DM without nephropathy, n=23 | DM with nephropathy | |
|---|---|---|---|---|
| Microalbuminuria, n=51 | Macroalbuminuria, n=31 | |||
| Age groups in years | ||||
| 21–30 | 6 (5.71%) | 00 (0.0%) | 00 (0.0%) | 00 (0.0%) |
| 31–40 | 30 (28.57%) | 04 (17.39%) | 09 (17.65%) | 02 (6.45%) |
| 41–50 | 26 (24.76%) | 07 (30.43%) | 19 (37.25%) | 08 (25.81%) |
| 51–60 | 28 (26.67%) | 10 (43.48%) | 18 (35.20%) | 14 (45.16%) |
| >60 | 15 (14.29%) | 2 (8.70%) | 05 (9.80%) | 07 (22.58%) |
| Gender | ||||
| Male | 72 (68.57%) | 16 (69.17%) | 34 (66.67%) | 19 (61.29%) |
| Female | 33 (31.43%) | 07 (30.43%) | 17 (33.33%) | 12 (38.71%) |
| Duration of DM in years | ||||
| 0–5 | 00 (0.0%) | 09 (39.13%) | 18 (35.29%) | 07 (22.58%) |
| 5–10 | 00 (0.0%) | 09 (39.13%) | 23 (45.10%) | 15 (48.39%) |
| >10 | 00 (0.0%) | 05 (21.74%) | 10 (19.61%) | 09 (29.03%) |
| Treatment modality | ||||
| Oral drugs | 00 (0.0%) | 16 (21.62%) | 39 (52.70%) | 19 (21.62%) |
| Insulin | 00 (0.0%) | 05 (29.41%) | 06 (35.29%) | 06 (35.29%) |
| Oral+insulin | 00 (0.0%) | 03 (21.42%) | 05 (35.71%) | 6 (42.85%) |
| Complications | ||||
| Retinopathy | 00 (0.0%) | 7 (33.3%) | 15 (28.8%) | 10 (31.3%) |
| PVD | 00 (0.0%) | 3 (14.3%) | 00 (0.0%) | 00 (0.0%) |
| CAD | 00 (0.0%) | 1 (4.8%) | 7 (13.5%) | 6 (18.8%) |
| Stroke | 00 (0.0%) | 2 (9.5%) | 4 (7.7%) | 2 (6.3%) |
| Anthropometric parameters | ||||
| Height (cm) | 156.56±9.44 | 160.43±7.72 | 162.58±6.30 | 162±7.17 |
| Weight in kg | 55.42±12.60 | 71.78±13.79 | 68.88±12.20 | 72.64±13.64 |
| BMI (kg/m2) | 22.96±3.59 | 27.73±4.13 | 26.40±4.06 | 27.60±3.95 |
| Haemodynamic parameters | ||||
| SBP mmHg | 120.85±13.01 | 137.82±17.04 | 131.17±19.45 | 130.96±17.19 |
| DBP mmHg | 77.14±10.16 | 88.69±9.67 | 82.35±10.31 | 83.54±9.84 |
Haemoglobin levels were low in both diabetics with and without nephropathy than controls whereas no significant difference was observed on intragroup analysis. The mean value of TLC and ANC was in lower in healthy control group than in other groups. ALC was significantly higher in diabetics without nephropathy compared to diabetics with nephropathy while no difference was observed in microalbuminuria and macroalbuminuria groups [Table 2].
| Parameters | Healthy control | DM without nephropathy | DM with nephropathy | P-value | |
|---|---|---|---|---|---|
| Microalbuminuria | Macroalbuminuria | ||||
| Hb | 13.09±1.23 | 11.86±1.85 | 11.98±1.51 | 12.04±1.77 | <0.0001 |
| Platelet count | 218.89±74.83 | 172.82±76.43 | 171.58±72.88 | 154.32±92.85 | <0.0001 |
| TLC | 6903.33±1030.72 | 8519.56±1909.78 | 7756.07±1181.15 | 8035.48±994.21 | <0.0001 |
| ANC | 4620.95±763.61 | 5509.56±1266.61 | 5487.06±960.59 | 5821.93±876.60 | <0.0001 |
| ALC | 2179.14±358.50 | 2731.74±794.55 | 2051.57±424.86 | 2007.41±312.99 | <0.0001 |
Hb: Haemoglobin in g/dL, platelet count in×103/c.u.mm, TLC: Total leucocyte count per c.u.mm, ANC: Absolute neutrophil count cells per c.u.mm, ALC: Absolute lymphocyte count cells/c.u.mm
NLR was found significantly increased (P < 0.0001) in patients with DN (2.81 ± 0.51) as compared to diabetes without nephropathy (2.12 ± 0.64) and healthy adults (2.06 ± 0.29). On intragroup analysis, it was found that NLR values had no statistically significant difference in diabetes with nephropathy-microalbuminuria and macroalbuminuria (P = 0.347), [Figure 2].
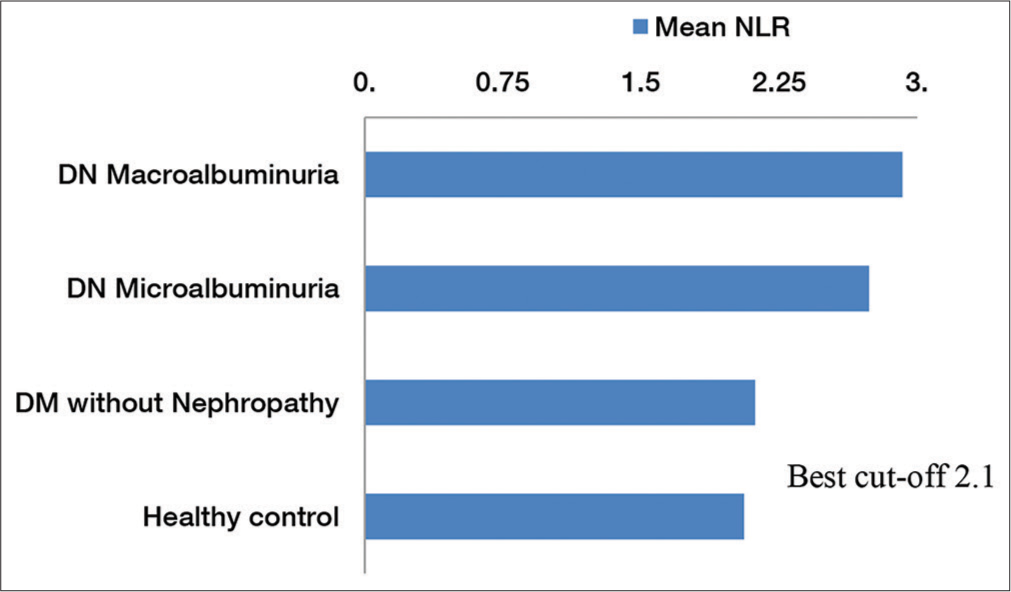
- Distribution of mean neutrophil-lymphocyte ratio (NLR) in different study groups. The diagram also shows the best cutoff value of NLR.
On receiver operating characteristic (ROC) curve analysis, it was found that the cutoff value of NLR was 2.1, indicating that NLR of 2.1 can identify DM with nephropathy from DM without nephropathy with sensitivity of 91.46% and specificity of 73.91% (AUC: 0.807; 95% CI 0.68–0.93; P < 0.0001), [Figure 3 and Table 3].

- Receiver operating characteristic (ROC) curve to determine the best cutoff of neutrophil-lymphocyte ratio to differentiate with and without diabetic nephropathy.
| NLR | DM with nephropathy | DM without nephropathy | OR (95% confidence interval) |
|---|---|---|---|
| >2.1 | 75 | 06 | OR=30.35 95% C.I. (7.90–122.44) Chi2=43.54 P< 0.0001 |
| ≤0.0 | 07 | 17 | |
| Total | 82 | 23 |
NLR: Neutrophil-lymphocyte ratio, DM: Diabetes mellitus
There was no significant difference in mean values of serum creatinine (mg/dL) and blood urea (mg/dL) in DM without nephropathy group, microalbuminuria group and macroalbuminuria group. Estimated GFR (eGFR) was found to be significantly reduced in DM with nephropathy group compared to DM without nephropathy group; however, intragroup analysis showed no difference between DM with nephropathy-microalbuminuria and DM with nephropathymacroalbuminuria group. There was no significant difference in mean fasting blood sugar levels as well as postprandial sugar levels in different diabetic groups. Total bilirubin, aspartate aminotransferase and alanine aminotransferase values were similar among all the study groups. Total cholesterol and triglycerides levels were significantly higher in diabetics than healthy controls group (P < 0.0001), [Table 4].
| Parameters | Healthy control | DM without nephropathy | DM with nephropathy | P-value | |
|---|---|---|---|---|---|
| Microalbuminuria | Macroalbuminuria | ||||
| UACR (mg/g) | 12.26±9.81 | 21.69±7.48 | 188.41±90.66 | 560.80±191.02 | <0.0001 |
| eGFR (mL/min/1.73 m2) | 89.15±26.55 | 88.10±30.08 | 76.27±29.34 | 71.32±26.54 | 0.0028 |
| B. Urea (mg/dL) | 30.81±7.94 | 36.52±12.85 | 33.98±11.67 | 32.51±12.20 | 0.0609 |
| Serum creatinine (mg/dL) | 0.97±0.24 | 1.00±0.52 | 1.12±0.41 | 1.15±0.39 | 0.0251 |
| FBS (mg/dL) | 95.48±8.85 | 143.95±40.92 | 138.25±29.36 | 147.22±43.98 | <0.0001 |
| PPBS (mg/dL) | 121.73±11.35 | 221.21±56.66 | 208.37±50.47 | 225.90±62.21 | <0.0001 |
| Total bilirubin (mg/dL) | 1.42±2.18 | 1.06±0.35 | 1.25±1.09 | 1.16±0.49 | 0.7332 |
| Aspartate aminotransferase (U/mL) | 34.85±17.29 | 36.69±14.28 | 34.49±18.23 | 39.09±17.17 | 0.6202 |
| Alanine aminotransferase (U/mL) | 36.94±16.14 | 40.43±20.13 | 33.07±15.04 | 36.51±17.36 | 0.3191 |
| Total cholesterol (mg/dL) | 139.6±20.57 | 190.69±56.60 | 188.01±57.91 | 181.61±54.29 | <0.0001 |
| TGA (mg/dL) | 114.52±23.80 | 199.34±56.35 | 172.67±47.44 | 191.22±44.50 | <0.0001 |
UACR: Urine albumin creatinine ratio, DM: Diabetes mellitus, eGFR: Estimated GFR
Diabetic population in the study was classified into different stages of chronic kidney disease (CKD) based on eGFR as per KDIGO classification of CKD. There were no individuals in the Stage-V. We found no statistically significant difference in distribution of NLR in different stages of CKD (P = 0.0914) [Figure 4].
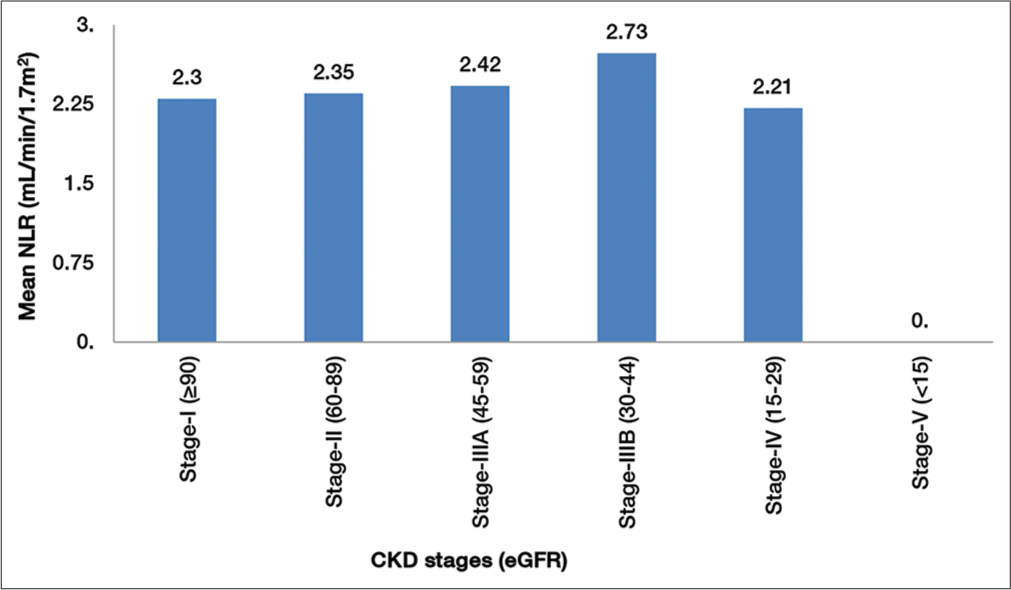
- Comparison of neutrophil-lymphocyte ratio (NLR) in stages of chronic kidney disease (CKD).
DISCUSSION
The present study examines evidence-based clinical status of NLR as a marker of DN. Clinical expression of DN follows a predictable course starting with proteinuria and terminating in ESRD. Duration of diabetes is a very important factor in the development of DN as demonstrated in several studies.[12,13] In the present study, we found that longer the duration of diabetes, higher the frequency of DN. Retinopathy is the most common microvascular complication among people with diabetes and it causes more than 10,000 new cases of blindness per year.[14] The Wisconsin Epidemiologic Study of Diabetic Retinopathy (WESDR Study),[15] done in 1980–1982, observed a prevalence of any diabetic retinopathy to be 49.8%. However, in the present study, 32 (30.5%) of 105 diabetics had retinopathy and out of 82 diabetics with nephropathy, 25 (30.5%) had retinopathy. The lower prevalence of diabetic retinopathy in the present study compared to the WESDR is probably because the WESDR study was done more than 25 years ago from when there is tremendous change in glycaemic and blood pressure control in the population and there are other risk factors such as genetics, ethnicity, presence of anaemia, duration of diabetes, serum lipids, smoking and availability of many new drugs which influence the development and progression of diabetic retinopathy.
In the present study, combined CAD and stroke had a prevalence of 21% (22 out of 105) with a definitive more prevalence of CAD 13 (15.9%) in diabetes with nephropathy group than without nephropathy group (4.8%). The possible explanation for the higher incidence of CAD in patients with DN would be coexisting traditional risk factors such as hypertension, dyslipidaemia and obesity. The other non-traditional risk factors that could contribute to CAD in DN are derangement in calcium-phosphate homeostasis, arterial stiffening, anaemia, chronic inflammation and endothelial dysfunction.[16,17] In addition, both diabetes and kidney dysfunction are known to cause hypercoagulable states with platelet dysfunction and alterations in plasma levels of clotting factors and mediators of fibrinolysis.[18] In the present study, only three out of 105 diabetics had peripheral arterial disease (PAD) and this finding may be because the true prevalence of PAD in people with diabetes has been difficult to determine. The reasons could be as most patients are asymptomatic, many do not report their symptoms, pain perception may be blunted by presence of peripheral neuropathy, absence of reliable screening modality and finally as our study was done in patients attending diabetic and endocrine OPD where most patients were asymptomatic. The major driving force for the increase in the prevalence of type 2 DM is obesity. Evidence suggests that the high prevalence of obesity and type 2 DM contributing to increase incidence of CKD and ESRD.
Overall 60% of diabetic subjects had a BMI (in kg/m2) in the range of 25–29.9, while 20.9% were in the range of 18–24.9 and 19.1% had a BMI of more than 30. Diabetic population (both nephropathy and without nephropathy groups) had higher values for both systolic and diastolic blood pressure compared to healthy control population which is comparable with the study done by Brenner et al.[19] The mean haemoglobin levels being significantly lower in both diabetes with and without nephropathy groups compared to healthy controls (P < 0.0001) but found no significant difference between nephropathy and without nephropathy groups. Similar results found in Thomas et al.[20] study. Total WBC count and ANC were significantly higher in diabetic subjects compared to healthy controls (P < 0.0001). The ALC was significantly lower in diabetes with nephropathy group compared to diabetes without nephropathy group (P < 0.0001). However, there was no statistically significant difference in microalbuminuria and macroalbuminuria group for ALC (P = 1.000). These findings are correlated well with study done by Kahraman et al.[21] As ours was a cross-sectional study, it is difficult to infer a relation between these two factors. It would be prudent to measure serial changes of WBC counts to know the exact role of them in pathogenesis of DN.
NLR was found significantly increased (P < 0.0001) in patients with DN as compared to diabetes without nephropathy and healthy adults. This finding is supported from study of recent years.[22] In the previous studies, no healthy non-diabetic subjects were included for comparison for NLR. The present study had healthy control group for better comparison of NLR value by knowing the normal distribution NLR values in healthy population since diabetes in itself is a chronic inflammatory state with NLR values being significantly higher than those of the healthy control as shown by Lou et al.[23] and type 2 diabetes is a heterogeneous population with many microvascular complications altering the NLR value. To find whether the increase in NLR has parallel increase with albuminuria, intragroup analysis was done but could not find statistically significant association of NLR value which is comparable with the previous studies.[21,24]
On ROC curve analysis, it was found that the cutoff value of NLR was 2.1 with a sensitivity of 91.46% and a specificity of 73.91% and these findings are correlated with the study done by Akbas et al.[24] The mean values of total cholesterol and triglycerides were significantly higher in both diabetes with and without nephropathy group than healthy controls (P < 0.0001), there was no statistically significant difference within the groups which are comparable with the study done by Khandare et al.[25] Managing dyslipidaemia in patients with DN is extremely important because patients with DN are at high risk of cardiovascular disease-associated death. To know the distribution of NLR in different stages of CKD, NLR values were compared in different stages of CKD and it was found that there was no statistically significant difference in NLR value (P = 0.0914).
Study limitations
The present study was a single-centre study with small sample size but adequate to decide the power of the study. It was a cross-sectional study, long-term follow-up of the patient with serial changes in NLR and WBC counts should be done to know the changes in different stages of DN.
CONCLUSION
On the basis of the results of the present study, we conclude that there was a significant correlation between NLR and DN. The NLR is a marker of DN in type 2 DM but no association with distribution of NLR in different stages of CKD.
In addition, a cutoff value of NLR (NLR 2.1) with a good sensitivity was found implying that NLR can be used as a screening test for early stages of DN in Indians.
NLR is a parameter which can be easily calculated from CBCs. This test is simple and inexpensive and should be done routinely.
Further research with serial changes in NLR and WBC counts should be measured to know the exact the role of them in different stages of DN.
Declaration of patient consent
The authors certify that they have obtained all appropriate patient consent.
Financial support and sponsorship
Nil.
Conflicts of interest
There are no conflicts of interest.
References
- International Diabetes Federation Diabetes Atlas (9th ed). Brussels, Belgium: International Diabetes Federation Diabetes; 2019.
- [Google Scholar]
- End-stage renal failure in Type 2 diabetes: A medical catastrophe of worldwide dimension. Am J Kidney Dis. 1999;34:795-808.
- [CrossRef] [Google Scholar]
- Chapter 1: Definition and classification of CKD. Kidney Int. 2013;3(Suppl (2011)):19-62.
- [CrossRef] [PubMed] [Google Scholar]
- Urinary biomarkers in the assessment of early diabetic nephropathy. J Diabetes Res. 2016;2016:4626125.
- [CrossRef] [PubMed] [Google Scholar]
- Role of inflammatory mechanisms in pathogenesis of Type 2 diabetes mellitus. J Cell Biochem. 2013;114:525-31.
- [CrossRef] [PubMed] [Google Scholar]
- Neutrophil lymphocyte ratio as a predictor of left ventricular apical thrombus in patients with myocardial infarction. Korean Circ J. 2016;46:768-73.
- [CrossRef] [PubMed] [Google Scholar]
- The relative lymphocyte count on hospital admission is a risk factor for long-term mortality in patients with acute heart failure. Am J Emerg Med. 2006;24:451-4.
- [CrossRef] [PubMed] [Google Scholar]
- Mechanisms of inflammatory responses and development of insulin resistance: How are they interlinked? J Biomed Sci. 2016;23:87.
- [CrossRef] [PubMed] [Google Scholar]
- The role of inflammatory cytokines in diabetic nephropathy. J Am Soc Nephrol. 2008;19:433-42.
- [CrossRef] [PubMed] [Google Scholar]
- Inflammatory molecules and pathways in the pathogenesis of diabetic nephropathy. Nat Rev Nephrol. 2011;7:327-40.
- [CrossRef] [PubMed] [Google Scholar]
- Standards of medical care in diabetes-2021. Diabetes Care. 2021;44:S11-33.
- [CrossRef] [PubMed] [Google Scholar]
- Predictors of renal morphological changes in the early stage of microalbuminuria in adolescents with IDDM. Diabetes Care. 1997;20:265-71.
- [CrossRef] [PubMed] [Google Scholar]
- Assessment of risk of overt nephropathy in diabetic patients from albumin excretion in untimed urine specimens. Arch Intern Med. 1991;151:1761-5.
- [CrossRef] [PubMed] [Google Scholar]
- Epidemiology of diabetes and diabetes-related complications. Phys Ther. 2008;88:1254-64.
- [CrossRef] [PubMed] [Google Scholar]
- The association of microalbuminuria with diabetic retinopathy. The Wisconsin epidemiologic study of diabetic retinopathy. Ophthalmology. 1993;100:862-7.
- [CrossRef] [Google Scholar]
- Aldosterone: Effects on the kidney and cardiovascular system. Nat Rev Nephrol. 2010;6:261-73.
- [CrossRef] [PubMed] [Google Scholar]
- Inflammation and cardiovascular events in individuals with and without chronic kidney disease. Kidney Int. 2008;73:1406-12.
- [CrossRef] [PubMed] [Google Scholar]
- Disorders of hemostasis associated with chronic kidney disease. Semin Thromb Hemost. 2010;36:34-40.
- [CrossRef] [PubMed] [Google Scholar]
- Effects of losartan on renal and cardiovascular outcomes in patients with Type 2 diabetes and nephropathy. N Engl J Med. 2001;345:861-9.
- [CrossRef] [PubMed] [Google Scholar]
- Unrecognised anemia in patients with diabetes. Diabetes Care. 2003;26:1164-9.
- [CrossRef] [PubMed] [Google Scholar]
- The relationship between neutrophil-to-lymphocyte ratio and albuminuria in Type 2 diabetic patients: A pilot study. Arch Med Sci. 2016;12:571-5.
- [CrossRef] [PubMed] [Google Scholar]
- Neutrophil-lymphocyte ratio is areliable predictive marker for early-stage diabetic nephropathy. Clin Endocrinol (Oxf). 2015;82:229-33.
- [CrossRef] [PubMed] [Google Scholar]
- Relationship between neutrophil-lymphocyteratio and insulin resistance in newly diagnosed Type 2 diabetes mellitus patients. BMC Endocr Disord. 2015;15:9.
- [CrossRef] [PubMed] [Google Scholar]
- Association of epicardial adipose tissue, neutrophil-to-lymphocyte ratio and platelet-to-lymphocyte ratio with diabetic nephropathy. Int J Clin Exp Med. 2014;7:1794-801.
- [Google Scholar]
- Study of neutrophil-lymphocyte ratio as novel marker for diabetic nephropathy in Type 2 diabetes. Indian J Endocrinol Metab. 2017;21:387-92.
- [CrossRef] [PubMed] [Google Scholar]