Translate this page into:
Estimation of Elevated Systolic Pulmonary Artery Pressure Using Right Ventricular Isovolumic Relaxation Time
*Corresponding author: Avinash Dayalal Arke, Senior Divisional Medical Officer, Department of Cardiology, Jagjeevan Ram Railway Hospital, Mumbai, Maharashtra, India. avinasharke1@gmail.com
-
Received: ,
Accepted: ,
How to cite this article: Arke AD, Babu PM, Borkar AM. Estimation of elevated systolic pulmonary artery pressure using right ventricular isovolumic relaxation time. Vidarbha J Intern Med 2022;32:15-20.
Abstract
Objectives:
Echocardiographic estimation of pulmonary hypertension (PH) in absence of tricuspid regurgitation (TR) remains a challenge. Isovolumic relaxation time (IVRT) measured by Doppler tissue imaging (DTI) can be a useful method to estimate PH. This study was designed to evaluate the feasibility and accuracy of the right ventricle (RV) IVRT for predicting PH.
Material and Methods:
We conducted an analytical cross-sectional study in 90 consecutive patients suspected or known to have pulmonary hypertension (PH). sPAP was assessed using TR jet velocity using a Bernoulli’s equation. RV IVRT was calculated using tissue Doppler imaging.
Results:
Out of the 90 consecutive patients [49 (54.4%) were female, mean age was 48 +/- 14 years and mean systolic pulmonary aretry pressure (sPAP) was 68.25+/- 29.15 mmHg. Mean RV IVRT was 67.29 ± 22.2 msec. We found a strong correlation between IVRT and systolic pulmonary pressure (r = 0.69, P < 0.0001) and a cutoff of 43 ms showed a sensitivity and specificity of 89% and 93%, respectively, for the prediction of elevated sPAP (≥39 mm Hg). However, this correlation reduces in the presence of RV dysfunction and elevated mean RA pressure.
Conclusion:
The calculation of IVRT by DTI is a simple and feasible method. It correlates well with sPAP. It is a useful echocardiographic parameter as a screening in patients at risk for PH, monitoring the disease progression and the effect of the treatment for PH, especially in patients with absent TR.
Keywords
Doppler tissue imaging
Isovolumic relaxation time
Pulmonary hypertension
Right ventricle
Tricuspid regurgitation

INTRODUCTION
Pulmonary hypertension (PH) is a pathophysiological disorder that complicates the majority of cardiovascular and respiratory diseases.[1] Non-invasive assessment of systolic pulmonary artery pressure (sPAP) is routine investigation in echocardiography laboratories using tricuspid regurgitation (TR) peak velocity (TRVmax) and Bernoulli’s equation. However, there are certain limitations of this method. In 20% of healthy population and up to 70% of patients with chronic obstructive pulmonary disease, assessment of TR jet is difficult.[2,3] There can be underestimation of sPAP mostly due to the underestimation of mean right atrial pressure (mRAP) and TRVmax. Simplified Bernoulli’s equation may underestimate the right ventricle (RV) to the right atrial (RA) pressure gradient since an inertial component of complete Bernoulli’s equation is neglected. In patients with severe TR, early equalisation of RV and RA pressures underestimates the RV-RA gradient.[4] Studies have shown that RV isovolumic relaxation time (IVRT) is a reliable tool to predict sPAP with good correlation.[5-7] Pulsed Doppler tissue imaging (DTI) is an excellent echocardiographic technique that provides information on the velocities and intervals from the myocardial wall.[8] The RV IVRT is the time interval from closure of the pulmonary valve to opening of the tricuspid valve and it can be measured using DTI. It is sensitive to changes in PAP and heart rate (HR).[9] This study was designed to evaluate the feasibility and accuracy of RV IVRT for predicting elevated sPAP.
MATERIAL AND METHODS
Study design
It was an analytical cross-sectional study, carried out at Vijaya Hospital, Chennai, from November 2015 to October 2016. The study protocol was approved by the Institutional Ethical Committee (Reg. No. ECR/180/Inst/TN/2013).
Participants
Patients were recruited from the outpatient and inpatient departments. Patients with suspected and/or established diagnosis of PH referred for echocardiography; in sinus rhythm with trivial to moderate TR (with good continuous wave Doppler spectral envelope), TRVmax 2.8 m/s were eligible for the study. Patients below 18 years with non-sinus rhythm, severe or no TR, tricuspid and/or pulmonary stenosis, prosthetic tricuspid valve, haemodynamic instability (infusion of vasoactive drugs and volume depletion by diuretics at the time of the study), left ventricular hypertrophy (RV IVRT was described to be increased in the absence of PH), myocardial infarction (to avoid the possible influence of ventricular interaction, regional wall motion hypokinesis may impair TDI recordings), complete RBBB and/or LBBB and presence of pacemaker or defibrillator lead in the RV were excluded from the study.[10]
Clinical evaluation
All the patients included in the study were subjected to detailed history and physical examination. They were evaluated for the aetiology of PH by appropriate tests as indicated: ECG, chest X-ray, anti-nuclear antibody, coagulation profile, HIV testing, high-resolution CT scan of the chest, ultrasound abdomen, and pulmonary function testing.
Echocardiographic evaluation
The echocardiographic study was done in patients with clinical suspicion of PH or known to have PH. The study was done using Philips iE33 [(F.3) with Vision 2007–Vision 2012 software] echocardiography machine (PureWave cardiac sector S5-1 [1–5 MHz] probe). Patients underwent routine transthoracic echocardiographic examination with standard measurements including sPAP estimation using TRVmax and Bernoulli’s equation. mRAP was estimated from the dimensions of the inferior vena cava and its inspiratory collapse.[11] IVC diameter <2.1 cm and collapse >50% correlate with normal mRAP of 0–5 mmHg (average 3 mmHg). IVC diameter <2.1 cm with <50% collapse and IVC diameter >2.1 cm with >50% collapse correspond to an intermediate RAP of 5–10 mmHg (average 8 mmHg). IVC diameter >2.1 cm with <50% collapse suggests a high RAP of 15 mmHg.[4,12] TDI measurements were done from a 2 mm sample volume from the apical window at the right lateral corner of the tricuspid annulus, as described by Caso et al.[6] The resulting velocities were recorded at a sweep speed of 100 mm/s. DTI ejection time (tET) was obtained between onset and cessation of S-wave (peak systolic tricuspid annular velocity). RV IVRT was measured as a time interval between the end of the systolic S’ wave and the beginning of the diastolic E’ wave. Isovolumic contraction time (IVCT) was measured between cessation of A’-wave and onset of S-wave [Figure 1]. To account for beat-to-beat variations in HR, an average of three consecutive cycles was obtained. As RV IVRT is HR dependent, adjusted RV IVRT0 was calculated as RV IVRT/√RR. Myocardial performance index (MPI-TDI) was calculated as the sum of IVCT and IVRT divided by ejection time (iVCT+IVRT)/(ET). An alignment between the tricuspid annulus motion and the ultrasound beam was kept as parallel as possible. High-frequency signals were excluded by the appropriate filter setting. Optimisation of gain setting was done to allow a clear tissue signal with minimal background noise. RV systolic function was assessed using S’ wave and TAPSE. RV systolic dysfunction was defined by S’ <9.5 cm/s and a tricuspid annular plane systolic excursion <17 mm.[13] All Doppler echocardiographic and TDI recordings were obtained at end expiration.
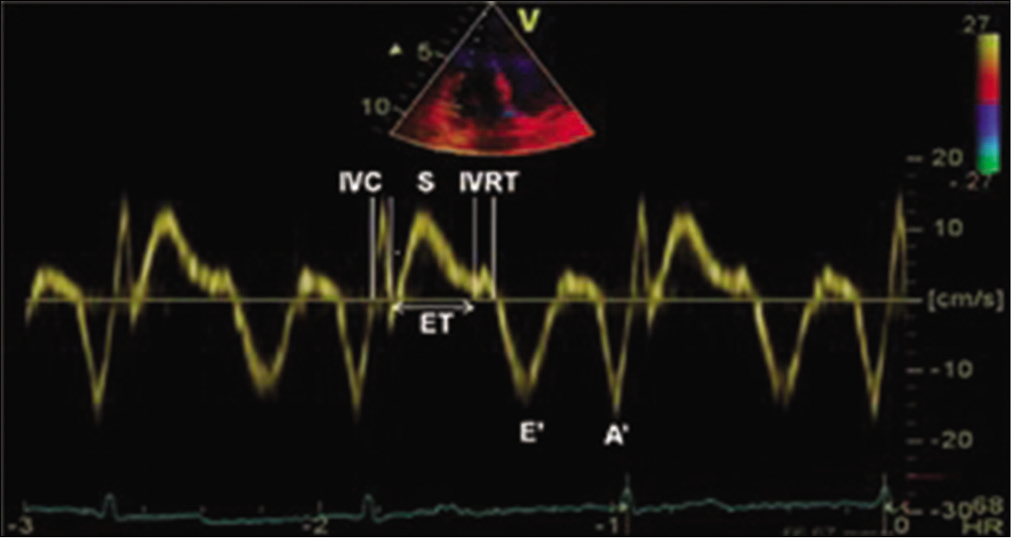
- Tissue Doppler imaging of the lateral tricuspid annulus showing measurement of isovolumic contraction time, isovolumic relaxation time, ejection time, tricuspid annular systolic velocity (S), tricuspid annular early (E’) and late diastolic velocities (A’).
Statistical analysis
Descriptive statistics were done for all data and were reported in terms of mean and standard deviation. Correlation analysis was done using Pearson’s ‘r’ correlation and ANOVA. Statistical significance was taken as P < 0.05. The data were analysed using SPSS version 16 and Microsoft Excel 2007. Correlation between sPAP determined by TR peak gradient and RV IVRT was established using linear regression and was expressed as the correlation coefficient. Receiver operating characteristics curves were constructed for the IVRT measurements for predicting sPAP of ≥39 mmHg or higher. Statistical significance was set at P < 0.05.
RESULTS
Patient characteristics
A study included 90 consecutive patients with PH who satisfied inclusion and exclusion criteria. Out of 90 patients, 49 (54.44%) were female. The mean age was 48 ± 14 years (20–89 years). The average sPAP was 68.25 ± 29.15 mmHg. 14/90 patients had normal sPA P <39 mmHg (36 ± 1.18 mmHg) whereas 76/90 patients had elevated sPAP ≥39 mmHg (74 ± 27.58). The aetiology of PH was PAH (27 patients), left heart disease (26 patients), lung disease (24 patients), chronic thromboembolic PH (five patients), and PH with unclear/ multifactorial mechanisms (eight patients). The baseline characteristics of the study population are presented in [Table 1].
| Characteristics | Mean |
|---|---|
| Sex (male/female) | 41/49 |
| Age (years) | 48±14 |
| Heart rate (BPM) | 76.8±12.8 |
| TRVmax (m/s) | 3.8±0.78 |
| sPAP (mmHg) | 68±29.15 |
| MPI | 0.58±0.18 |
| Tricuspid S’ (cm/s) | 11±2.74 |
| TAPSE (mm) | 17±4.1 |
| mRAP (mmHg) | 6.6±4.4 |
| IVRT (ms) | 67.47±22.2 |
| IVRT/√RR (ms) | 76±24.47 |
Right ventricular IVRT measured by tissue Doppler imaging and sPAP
The average RV IVRT and adjusted RV IVRT were 67.29 ± 22.2 ms and 75 ± 24.47 (36–136 ms), respectively. There was a strong correlation between IVRT and sPAP in our population (r = 0.69, P < 0.0001) which did not improve with adjustment for HR, IVRT/√RR (r = 0.61, P < 0.0001). A cutoff of 43 ms IVRT showed a sensitivity and specificity of 89% and 93%, respectively, for the prediction of elevated sPAP (as defined sPAP ≥39 mmHg) [Figure 2].
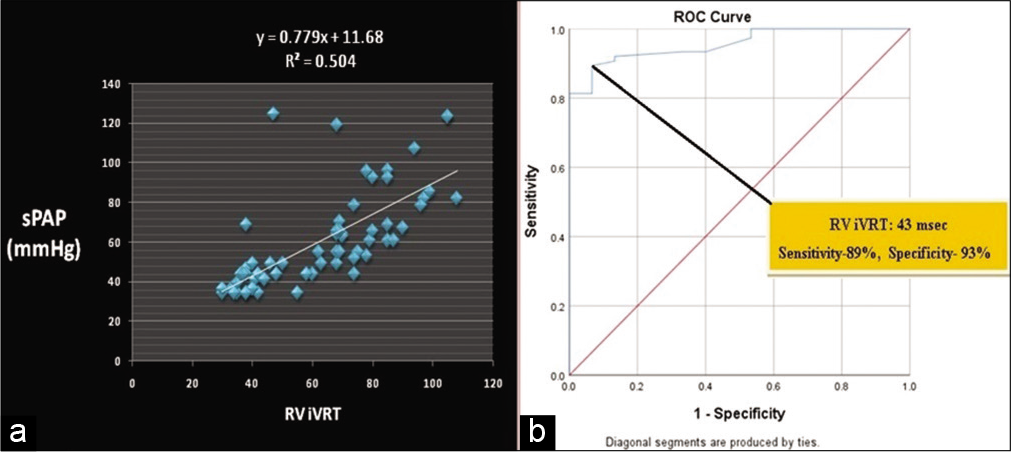
- (a) Correlation between right ventricle isovolumic relaxation time and sPAP (r = 0.69, P < 0.0001). (b) ROC curve for predicting systolic pulmonary artery pressure of 40 mmHg or higher. Area under the curve 0.956 (95% CI 0.916–0.995).
Right ventricular IVRT measured by tissue Doppler imaging and right ventricular function
RV dysfunction was found in 28/90 patients. Average TAPSE was 16.98 ± 4.13 mm and average tricuspid S’ was 10.63 ± 2.76 cm/s. There was no correlation between RV IVRT and either TAPSE or tricuspid S’ (–0.29, P = 0.01483 and –0.22, P = 0.0782, respectively) [Table 2]. Correlation between RV IVRT and sPAP was reduced in patients with RV systolic dysfunction (r = 0.55; P = 0.0048) when compared with patients with a preserved RV systolic function (r = 0.71; P < 0.0001) [Table 2].
| Correlation with RVSP | Correlation with RVSP | |||
|---|---|---|---|---|
| Normal RV function (n=62) | RV dysfunction (n=28) | Normal mean RA pressure (≤8 mmHg) (n=75) | Elevated mean RA pressure (>8 mmHg) (n=15) | |
| RV IVRT | 0.71 (P<0.0001) | 0.55 (P=0.0481) | 0.66 (P<0.001) | 0.02 (P=0.045) |
| RV IVRT/V I | 0.66 (P<0.0001) | 0.41 (P=0.0346) | 0.60 (P<0.001) | –0.18 (P=0.038) |
Right ventricular IVRT measured by tissue Doppler imaging and RA pressure
There was a strong correlation between RV IVRT and sPAP in patients with PH with normal mean RA pressure (mRAP≤8 mmHg; r = 0.66, P < 0.001) whereas correlation was poor in patients with high mean RA pressure (mRAP>8 mmHg; r = 0.02, P = 0.045). This correlation did not improve when RV IVRT was adjusted for HR [Table 2].
DISCUSSION
The PAP reflects both the left and right heart functions and thus has diagnostic, therapeutic, and prognostic values for patients with cardiac and pulmonary diseases. The most widely accepted and employed echocardiographic method for the estimation of PAPs relies on the measurement of TRVmax. Often times, TR is not sufficient to perform this measurement and this method is appropriate in 75–80% of patients.[3,14,15] With the advent of technology, TDI has also been used in defining PH.[7] It has been found that TDI is superior to the blood flow Doppler since it reflects the functional status of the myocardium directly and is less affected by background noise and the loading condition. In the specific study, we investigated an alternative echocardiographic method for the estimation of increased sPAP.
In his study, Burstin has concluded that sPAP could be estimated non-invasively by measuring the time interval between the pulmonary valve closure to the onset of tricuspid flow using phonocardiography and pulse tracings.[16] TDI is a newer technique that provides the assessment of myocardial motion and time intervals throughout the cardiac cycle.[17] In this study, we found a strong positive correlation between RV IVRT measured by TDI and sPAP estimated from TRVmax. This result is consistent with numerous Doppler catheterisation studies conducted from 1967 to 2016 [Table 3].[3,5-9,15,18-22] All these studies compared RV IVRT measured by TDI with pulmonary artery systolic pressure measured invasively at catheterisation laboratory. We estimated pulmonary artery systolic pressure noninvasively by adding the estimated mean RAP (as per IVC diameter and respirophasic variation) and RV to RA pressure gradient from TR. It has been shown that TR peak pressure gradient correlates significantly with sPAP.[18,23,24] Our results are consistent with Cabrita et al. who studied the correlation between IVRT and systolic PAP measured through echocardiography, in which they found a strong correlation between IVRT and sPAP [Table 3].[8] They found that a cutoff of 75 ms IVRT showed a sensitivity and specificity of 94 and 97%, respectively, for the prediction of PH (as defined PASP >39 mmHg). Fourteen out of 90 patients in our study had normal sPAP. This could be the result of underestimation of mRAP based on IVC diameter respirophasic variation.
| Study | sPAP | RV IVRT | Correlation between sPAP and RV IVRT (P value) | MPI | Correlation between MPI and RV IVRT (P value) | Tricuspid S’ | Correlation between tricuspid S’ and RV IVRT (P value) |
|---|---|---|---|---|---|---|---|
| Dambrauskaite et al.,[7]2005 n=26 |
- | - | 0.74 (P<0.001) | - | - | - | - |
| Lindqvist et al.,[9]2006 n=26 |
- | - | 0.71a (P<0.001) | - | - | - | - |
| Bre’chot et al.,[27]2008 n=38 |
64±22 | 83±34 | 0.87 (P<0.0001) | - | - | 10.8±1.3 | - |
| Cabrita et al.,[8]2013 n=196 |
81.4±24.7 | 110.5±29.2 | 0.5 (P<0.0001) 0.52a (P<0.0001) |
0.67±0.22 | 0.41 (P<0.001) 0.43a (P<0.001) |
10±2.5 | –0.14 (P=0.04) –0.13a (P=0.05) |
| El-Baz et al.,[21]2014 n=30 |
- | - | 0.8 (P<0.0001) | - | - | - | - |
| Parsaee et al.,[22]2016 n=38 |
- | 73.7±11.7 | Positive correlation | 0.56±0.1 | - | 10.4±2.47 | - |
| Current study n=90 |
68±29.15 | 67.29±22.2 75±24.5 |
0.69 (P<0.001) 0.61a (P<0.001) |
0.7±0.19 | 0.89 (P<0.001) 0.87a (P<0.001) |
10.63±2.74 | –0.25 (P<0.05) –0.26a (P<0.04) |
RV systolic function was assessed using tricuspid S’ wave and TAPSE. The effects of the RV systolic function were also investigated in this correlation. The correlation between RV IVRT and sPAP was higher in patients with preserved RV systolic function than with RV dysfunction. It has been shown that RV IVRT gets prolonged during RV dysfunction even in the absence of PAH.[10] It appears that RV dysfunction reduces the rate of the RV pressure drop during relaxation, increasing the diastolic PAP and lengthening the RV IVRT. Therefore, it indicates that RV dysfunction may perturb the evaluation of sPAP using RV IVRT.
Abbas et al. demonstrated an inverse relationship between IVRT and RAP in a Doppler catheterisation study in 21 patients, with 80% sensitivity and 87.7% specificity for IVRT 59 ms to predict RAP 8 mmHg.[25] It means an increase in mRAP should shorten IVRT. Yoshifuku et al. also described RV IVRT to be pseudonormalised in patients with elevated RAP during acute right ventricular myocardial infarction.[26] In our study, we found a positive correlation between RAP and RV IVRT. RAP was higher in patients with PAH. This is probably because the increase in RAP was a consequence of elevated right ventricular filling pressures in our population, which is consistent with a study by Bre´chot et al., as opposed to Abbas and Yoshifuku et al. patients where the principle mechanism was RV failure.[27] Correlation between RV IVRT and sPAP was further improved when patients with elevated RAP were excluded from the study [Table 2].
As IVRT is HR dependent, it was adjusted for HR by dividing IVRT by root of RR time interval (IVRT/√RR). In our study, there was a strong correlation between IVRT with sPAP and did not improve when IVRT was corrected for HR as described by others.[5-7,9,19] This is probably because HR was in the same range in our population, and corrected rIVRT may be useful in case of extreme HR.
The imaging technique plays an important role in the measurement of RV IVRT that accurately reflects pulmonary pressure. Proper placement of the Doppler sample volume at the lateral tricuspid annulus and also its accurate alignment to the long axis is essential. As a non-invasive method, IVRT was able to distinguish between patients with and without PH, regardless of the aetiology. Since DTI has wide availability, the signal is easy to obtain in almost all patients; more studies remain to be done with prospectively validating tissue Doppler techniques and its incorporation into clinical practice.
CONCLUSION
The calculation of IVRT by DTI is a simple and feasible method. It correlates well with sPAP. Hence, RV IVRT can be used as an alternative to TR derived sPAP in the absence of TR. This method should be used as screening in patients at risk for PH, monitoring the disease progression and the effect of treatment. Care has to be taken while assessing patients with RV dysfunction and elevated mRAP.
Limitation
Firm conclusions about the directions of causality cannot be drawn in a cross-sectional design. Thus, relationships among variables must be interpreted with caution, presence of a heterogeneous population of patients who were not divided into groups with regard to aetiology. Angle correction to the measurement of IVRT by DTI was not used though this is not a major source of error, since we were measuring time intervals that are minimally affected by the angle of incidence. Ultrasound contrast agents or agitated saline was not used to enhance technically inadequate TRV signals. We did not compare the sPAP by echocardiography with the right heart catheterisation data, considered the gold standard. It might have provided more accurate information about the relationships observed between IVRT and sPAP.
Declaration of patient consent
Consent of Patient/Legally authorised Representative have been taken.
Financial support and sponsorship
Nil.
Conflicts of interest
There are no conflicts of interest.
References
- 2015 ESC/ERS Guidelines for the diagnosis and treatment of pulmonary hypertension. Eur Heart J. 2016;37:67-119.
- [CrossRef] [PubMed] [Google Scholar]
- Clinical correlates and reference intervals for pulmonary artery systolic pressure among echocardiographically normal subjects. Circulation. 2001;104:2797-802.
- [CrossRef] [PubMed] [Google Scholar]
- Attempts at measuring pulmonary arterial pressure by means of Doppler echocardiography in patients with chronic lung disease. Eur Respir J. 1989;2:856-60.
- [Google Scholar]
- Guidelines for the echocardiographic assessment of the right heart in adults: A report from the american society of echocardiography endorsed by the European association of echocardiography, a registered branch of the European society of cardiology, and the Canadian society of echocardiography. J Am Soc Echocardiogr. 2010;23:685-713.
- [CrossRef] [PubMed] [Google Scholar]
- Non-invasive estimation of pulmonary artery systolic pressure with Doppler ultrasound. Br Heart J. 1981;45:157-65.
- [CrossRef] [PubMed] [Google Scholar]
- Association between myocardial right ventricular relaxation time and pulmonary arterial pressure in chronic obstructive lung disease: Analysis by pulsed Doppler tissue imaging. J Am Soc Echocardiogr. 2001;14:970-7.
- [CrossRef] [PubMed] [Google Scholar]
- The evaluation of pulmonary hypertension using right ventricular myocardial isovolumic relaxation time. J Am Soc Echocardiogr. 2005;18:1113-20.
- [CrossRef] [PubMed] [Google Scholar]
- Validation of the isovolumetric relaxation time for the estimation of pulmonary systolic arterial blood pressure in chronic pulmonary hypertension. Eur Heart J Cardiovasc Imaging. 2013;14:51-5.
- [CrossRef] [PubMed] [Google Scholar]
- Right ventricular myocardial isovolumic relaxation time and pulmonary pressure. Clin Physiol Funct Imaging. 2006;26:1-8.
- [CrossRef] [PubMed] [Google Scholar]
- Doppler echocardiographic evaluation of right ventricular diastolic function in hypertrophic cardiomyopathy. Eur J Echocardiogr. 2002;3:143-8.
- [CrossRef] [PubMed] [Google Scholar]
- Noninvasive estimation of right atrial pressure from the inspiratory collapse of the inferior vena cava. Am J Cardiol. 1990;66:493-6.
- [CrossRef] [Google Scholar]
- Relation of mean right atrial pressure to echocardiographic and Doppler parameters of right atrial and right ventricular function. Circulation. 1996;93:1160-9.
- [CrossRef] [PubMed] [Google Scholar]
- Right ventricular systolic function assessment: Rank of echocardiographic methods vs. cardiac magnetic resonance imaging. Eur J Echocardiogr. 2011;12:871-80.
- [CrossRef] [PubMed] [Google Scholar]
- Noninvasive estimation of systolic pulmonary artery pressure using Doppler echocardiography in patients with chronic obstructive pulmonary disease. Chest. 1989;96:1258-62.
- [CrossRef] [PubMed] [Google Scholar]
- Doppler echocardiographic evaluation of pulmonary artery pressure in chronic obstructive pulmonary disease. A European multicentre study. Working group on noninvasive evaluation of pulmonary artery pressure European Office of the World Health Organization, Copenhagen. Eur Heart J. 1991;12:103-11.
- [CrossRef] [PubMed] [Google Scholar]
- An alternative echocardiographic method to estimate mean pulmonary artery pressure: Diagnostic and clinical implications. J Am Soc Echocardiogr. 2009;22:814-9.
- [CrossRef] [PubMed] [Google Scholar]
- Tissue Doppler imaging: A new prognosticator for cardiovascular diseases. J Am Coll Cardiol. 2007;49:1903-14.
- [CrossRef] [PubMed] [Google Scholar]
- Comparison of three Doppler ultrasound methods in the prediction of pulmonary artery pressure. J Am Coil Cardiol. 1987;9:549-54.
- [CrossRef] [Google Scholar]
- Determination of pressure in the pulmonary artery by external graphic recordings. Br Heart J. 1967;29:396-404.
- [CrossRef] [PubMed] [Google Scholar]
- The prediction of pulmonary artery systolic pressure and vascular resistance by using tricuspid annular tissue Doppler imaging. Anadolu Kardiyol Derg. 2002;2:302-6.
- [Google Scholar]
- Usefulness of right ventricular isovolumic relaxation time in predicting systolic pulmonary artery pressure. Egypt Heart J. 2014;66:1-35.
- [CrossRef] [Google Scholar]
- Time from the beginning of the right ventricle isovolumetric contraction to the peak of the S Wave: A new TDI Indicator for the non-invasive estimation of pulmonary hypertension. Res Cardiovasc Med. 2016;5:e26494.
- [CrossRef] [PubMed] [Google Scholar]
- Noninvasive estimation of right ventricular systolic pressure by Doppler ultrasound in patients with tricuspid regurgitation. Circulation. 1984;70:657-62.
- [CrossRef] [PubMed] [Google Scholar]
- Continuous wave Doppler determination of right ventricular pressure: A simultaneous Doppler-catheterization study in 127 patients. J Am Coll Cardiol. 1985;6:750-6.
- [CrossRef] [Google Scholar]
- Noninvasive assessment of right atrial pressure using Doppler tissue imaging. J Am Soc Echocardiogr. 2004;17:1155-60.
- [CrossRef] [PubMed] [Google Scholar]
- Pseudonormalized Doppler total ejection isovolume (Tei) index in patients with right ventricular acute myocardial infarction. Am J Cardiol. 2003;91:527-31.
- [CrossRef] [Google Scholar]
- Usefulness of right ventricular isovolumic relaxation time in predicting systolic pulmonary artery pressure. Eur J Echocardiogr. 2008;9:547-54.
- [CrossRef] [PubMed] [Google Scholar]