Translate this page into:
Study of Correlation of Arterial Blood Gas Measurements with Peripheral Venous Blood Gas Values in Adult Patients Admitted in ICU in Tertiary Care Hospital in Central India – A Cross-Sectional Study
*Corresponding author: Kunalsinh Khushalsinh Shisodiya, Department of General Medicine, Govt Medical College, Nagpur, Maharashtra, India. kunalsinh. shisodiya@gmail.com
-
Received: ,
Accepted: ,
How to cite this article: Shisodiya KK, Vyawahare M. Study of correlation of arterial blood gas measurements with peripheral venous blood gas values in adult patients admitted in ICU in tertiary care hospital in central India – A cross-sectional study. Vidarbha J Intern Med 2023;33:21-6.
Abstract
Objectives:
Arterial blood gas (ABG) analysis is an essential investigation for assessment of ventilation, oxygenation and acid–base status in critically ill patients. Arterial puncture to obtain arterial blood is more invasive procedure than venous and has more potential complications. The present study was undertaken to find out the correlation between arterial and peripheral venous blood gas (VBG) values for PO2 (Partial pressure of oxygen), PCO2 (Partial pressure of carbon dioxide), pH (Potential of hydrogen) and HCO3 (bicarbonates).
Material and Methods:
A total of 131 consecutive patients admitted to intensive care unit (ICU) requiring ABG analysis to determine their acid–base status or ventilatory status were included in the study. Arterial and venous blood samples were obtained with a heparinised syringe within <15 min, after performing modified Allen’s test and were analysed using blood gas analysis machine. The mean of pH, pCO2, HCO3, and PO2, values in arterial and venous samples was determined, along with peripheral arterial oxygen saturation (SpO2) of patients.
Results:
ABG and VBG analysis correlated well for pH, pCO2 and HCO3, as their correlation coefficient (r) were 0.976, 0.992 and 0.984, respectively, whereas PO2 has correlation coefficient of 0.010 which suggests that there was poor correlation in PO2. For each unit increase in pCO2, pH and HCO3 of VBG, all these ABG changes by 0.9831 units, 0.914 units and 0.992 units, respectively. Peripheral O2 saturation (SpO2) correlates well with arterial O2 saturation, however, does not correlate with venous O2 saturation.
Conclusion:
The results show that VBG analysis can be a substitute for ABG for evaluation of ventilatory function and acid–base imbalance for pH, pCO2 and HCO3 in patients of ICU setup in many clinical contexts.
Keywords
Arterial blood gas
Venous blood gas
Bicarbonates
pH
pCO2
SpO2

INTRODUCTION
Managing intensive care unit (ICU) patients without a working knowledge of acid–base disorders are like trying to clap your hands when you have none, that is, it simply cannot be done.[1] Blood gas analysis is frequently requested as part of the point-of-care testing for emergency or critical care patients presenting with metabolic or respiratory abnormalities. Arterial blood gas (ABG) analysis has an important role in determining acid– base balance and blood-gas status in mechanically ventilated patients and other patients admitted to ICU set-up. Despite its high efficacy in evaluating patient’s responses to treatment regimens, ABG test has some complications. The most common complications associated with arterial puncture are pain, arterial injury, infection, thrombosis with distal digit ischemia, haemorrhage and aneurysm formation.[2] Therefore, to decrease its complications, alternatives such as venous blood gas (VBG) analysis, pulse oximetry and end-tidal Carbon Dioxide, seem to be useful.[3]
VBG sampling obtaining venous blood is easier and the procedure is less complicated. It is an alternative method of estimating systemic carbon dioxide and pH that does not require arterial blood sampling. Performing a VBG rather than an ABG is particularly convenient in the intensive care unit so that venous blood can be quickly and easily obtained. Recent studies have shown that values of acid– base status measured in peripheral venous blood correlate well with those measured in arterial blood, at least for values of pH, bicarbonate and carbon dioxide tension (pCO2).[4,5] The inability of a VBG to measure oxygenation is the major drawback compared with an ABG. To overcome this limitation, VBGs are often considered in combination with pulse oximetry.
However, various studies are carried out to compare ABG versus VBG analysis, and few comparative studies are carried out which are done globally, but similar studies in India are lacking so present study was done to find out if there any correlation exists between ABG analysis versus VBG analysis and to assess if VBG can replace ABG.
MATERIAL AND METHODS
After obtaining Institutional Ethical Committee approval and written informed consent from all the patients, this hospital-based cross-sectional observational study was performed in the Department of General Medicine, at Tertiary Care Institute of Central India for around 2 years from September 2019 to September 2021. Patients were included in the study if they were deemed by their treating doctor to require an ABG analysis to determine their acid–base status or ventilatory status. A total of 131 consecutive patients of both sexes, age more than 18 years with all the modalities of respiratory support in ICU were enrolled. Patients of age <18 years and had mean arterial pressure <100 and patients not willing to perform tests/not given consent were excluded from the study.
All patients were interviewed as pre-set pro forma and careful physical examination was done. A detailed history, demographic data, presenting complaints, pulse rate, blood pressure and respiratory rate were measured at the time of admission. Clinical examination and routine laboratory tests were done. Arterial and venous blood samples were collected simultaneously with minimum delay between obtaining samples. Arterial and venous blood samples were obtained with a heparinised syringe, labelled, within <15 min, after performing modified Allen’s test and were analysed using blood gas analysis machine and calibrated according to standard quality assurance protocols. The mean of pH, pCO2, HCO3, and PO2, values in arterial and venous samples was determined along with peripheral arterial oxygen saturation (SpO2) of patients. Further, investigations were performed according to case-to-case basis.
Data analysis
Data were analysed using statistical software STATA version 10.1, 2011. Descriptive statics were calculated to summarise quantitative variables by mean and standard deviation and qualitative variables by frequency and percentages. Comparison between ABG and VBG values such as pH, pCO2, HCO3 and PO2 was done by Pearson test of correlation. The estimation of arterial values from the venous values was performed using linear regression equations. P < 0.05 was considered statistically significant.
RESULTS
A total of 131 patients admitted to ICU requiring ABG analysis were included in the study. The maximum number of patients was in the age group of 40−49 years (40.46%) with mean age of patients, was 43.91 ± 10.33 years, ranging from 21 to 76 years. Male patients predominated in the study (64.89%), as shown in [Table 1]. Patients having hypotension were excluded and most of patients were normotensive with systolic blood pressure (SBP) between 110 and 130 mm of Hg and diastolic blood pressure (DBP) between 80 and 90 mm of Hg. The mean SBP was 121.37 ± 17.35 mm Hg and mean DBP was 80.30 ± 1.72 mm Hg.
| Demographic data | Number of patients | Percentage |
|---|---|---|
| Age-group (years) | ||
| 20–29 | 11 | 8.4 |
| 30–39 | 27 | 20.61 |
| 40–49 | 53 | 40.46 |
| 50–59 | 29 | 22.14 |
| 60–79 | 11 | 8.40 |
| Sex | ||
| Male | 85 | 64.89 |
| Female | 46 | 35.11 |
Patients on all modalities of respiratory support were included; however, most of patients were on spontaneous respiration (54.96%), as shown in [Table 2]. The mean SpO2 was 97.77 ± 0.53, ranging from 96 to 98.
| Mode of respiratory support | Number of patients | Percentage |
|---|---|---|
| On RA | 72 | 54.96 |
| On O2 | 15 | 11.46 |
| On NIV | 20 | 15.26 |
| Intubated | 24 | 18.32 |
RA: Room Air, O2: Oxygen, NIV: Non Invasive Ventilation
On ABG analysis, patients having normal pH were predominant patients (45.80%), on VBG also, patients having normal pH were predominant (50.38%), pH of ABG and pH of VBG showed positive, very strong and significantly strong linear relationship, [Figure 1]. For each unit, increase in PH of VBG the PH of ABG changes by 0.914 units. The model explains 95% of the observed variation in the data. The mean pH of ABG and VBG was 7.30 ± 0.19 and 7.27 ± 0.21, respectively.
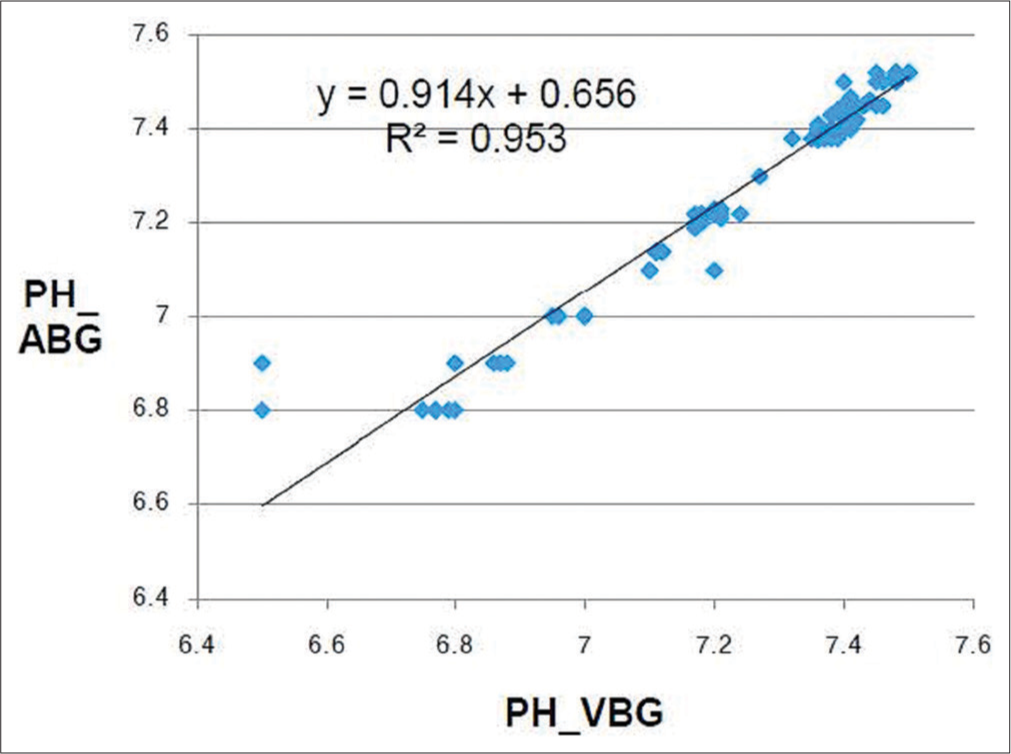
- Correlation between PH of ABG and PH of VBG. ABG: Arterial blood gas, VBG: Venous blood gas. y: value of pH of ABG, R2: coefficient of determination
On ABG analysis, patients having PO2 of 61−100 were predominant (70.99%), while on VBG analysis, patients having PO2 of <60 were predominant (85.49%). Model for predicting PO2-ABG value (Y) knowing PO2-VBG value (X) was not useful as the model fails to explain 98% of the observed variation in the data, [Figure 2]. The mean PO2 of ABG and VBG was 96.89 ± 29.49 and 49.43 ± 23.39, respectively.

- Correlation between PO2 ABG and VBG. ABG: Arterial blood gas, VBG: Venous blood gas, PO2 - Partial pressure of oxygen. y: value of pH of ABG, R2: coefficient of determination.
On ABG analysis, patients having pCO2 of 25−40 were predominant (59.54%), while on VBG analysis, patients having pCO2 of <40 and 41−80 were equal and more predominant (35.87%) than other categories. pCO2 of VBG and pCO2 of ABG showed positive perfect significant linear relationship [Figure 3]. For each unit increase in pCO2-VBG, the pCO2-ABG changes by 0.9831 units. The model explains 98% of the observed variation in the data. The mean pCO2 of ABG and VBG was 47.49 ± 24.30 and 53.38 ± 24.53, respectively.

- Correlation between PCO2 ABG and VBG. ABG: Arterial blood gas, VBG: Venous blood gas, PCO2: Partial pressure of carbon dioxide. y: value of pH of ABG, R2: coefficient of determination.
On ABG analysis, patients having HCO3 of more than 27 meq were predominant (45.05%), while, on VBG analysis, patients having HCO3 of more than 27 meq were predominant (58.03%). Thus, HCO3 of ABG and HCO3 of VBG showed positive almost perfect significant linear relationship [Figure 4]. For each unit, increase in HCO3 of VBG and HCO3 of ABG changes by 0.992 units. The model explains 97% of the observed variation in the data. The mean HCO3 of ABG and VBG was 25.40 ± 8.11 and 27.66 ± 8.05, respectively.

- Correlation between HCO3 ABG and VBG. ABG: Arterial blood gas, VBG: venous blood gas. y: value of pH of ABG, R2: coefficient of determination, HCO3: Bicarbonate
Peripheral O2 saturation (SpO2) showed positive, weak, non-significant, linear relationship with arterial PO2 (r = 0.1341 and P = 0.1266), while SpO2 and venous PO2 showed positive, very weak and non-significant linear relationship (r = 0.0756; P = 0.3910).
From [Table 3], it was observed that pH, pCO2 and HCO3 were well correlated as their correlation coefficient (r) was 0.976, 0.992 and 0.984, respectively. Hence, there was strong, significant relationship between the parameters mentioned above. Whereas PO2 has corelation coefficient (r) of 0.010 which suggests that for PO2, there was very weak and no significant relationship.
| Pairs of ABG and VBG | Pearson’s Correlation Coefficient | Interpretation of nature and strength of existing relationship between two variables | |
|---|---|---|---|
| R | P-value | ||
| PH of ABG and PH of VBG | 0.9766 | 0.0001 | Positive, very strong, significant linear relationship |
| PO2 ABG and PO2 VBG | 0.0105 | 0.2486 | Positive, very weak, non-significant linear relationship |
| PCO2 ABG and PCO2 VBG | 0.9922 | 0.0001 | Positive, perfect, significant linear relationship |
| HCO3 ABG and HCO3 VBG | 0.9848 | 0.0001 | Positive, almost perfect, significant linear relationship |
ABG: Arterial blood gas, VBG: Venous blood gas, R: Pearson correlation coefficient, PO2: Partial pressure of oxygen, PCO2: Partial pressure of carbon dioxide, HCO3 - Bicarbonate
DISCUSSION
Measurement of arterial values of pH, bicarbonate, pCO2 and paO2 is important for monitoring clinical status and the response of therapy in critically ill patients. Getting samples for ABG is invasive and technically difficult and has potential complications. This study aimed to find the extent to which arterial and venous values for pH, pCO2 and bicarbonate are related. The mean age of patients was 43.91 ± 10.33 years which is comparable to study conducted by Malinoski et al.[6] Out of 131 patients, 64.89% were male and 35.11% were female, this is similar to the study conducted by Bohloli et al.[7] Among 131 cases, we had excluded already the patients who were in hypotension/shock. As blood pressure especially hypotension affects parameters in correlation of ABG and VBG, as per previous studies,[6-9] so blood pressure has special importance in the present study. Patients can either be taking spontaneous respiration in room air or can be on respiratory support like supplemental oxygen, non-invasive ventilation or mechanical ventilation. In the present study, patients on all modalities of respiratory support were included; however, most of patients were on spontaneous respiration (54.96%) which is comparison with other studies.[7,10]
In the present study, mainly pH, PO2, pCO2 and HCO3 were measured and correlated among ABG and VBG. In the previous studies, all these parameters are not correlated, few of them are correlated like in Malinoski et al.,[6] Rang et al.[8] and Kim et al.[10] studies. pH of present study was better correlated with Bohloli et al.[7] study as compared to others, whereas in case of PO2 and HCO3 Razi and Moosavi[9] study, while, in case of pCO2, Rang et al.[8] study is nearly correlated. However, correlation coefficient (r) between arterial and venous parameters for pH, PO2, pCO2 and HCO3 were comparable to study conducted by Rang et al. in brief.[8]
We also correlated peripheral O2 saturation (SpO2) and arterial PO2 and venous PO2, after the complete study, we found that Pearson’s correlation coefficient (r) was 0.1341 and 0.0756 for correlation between SpO2 and PO2 ABG; SpO2 and PO2 VBG, respectively, means both were non-significant correlation. Multivariate and bivariate (Regression) analyses were performed and prediction models were built. Both multivariate and bivariate regression models were not found useful in predicting the SpO2 values in case of ABG and VBG, but VBG analysis does have excellent correlation with ABG analysis (r > 0.9) for pH, pCO2 and HCO3 (bicarbonate) parameters for comparison. The study used single regression model for calculating ABG parameters values from VBG parameters values. In regression analysis, the dependent variable is denoted by Y-axis and independent variable is denoted by X-axis. So that ABG parameters are kept on Y-axis, whereas VBG parameters are on x-axis. According to measured parameters of the model, regression coefficient of arterial pCO2 (r = 0.99, P < 0.01) can be predicted significantly by venous pCO2 through the following regression model:
1. ABG. pCO2 = (0.9831 × VBG.pCO2) – 4.9921
High coefficient of determination of this model (R2 linear = 0.9845) is indicative of its great ability to predict arterial pCO2 with well repeatability and determination in patients admitted to the ICU. Measured parameters of regression model of arterial bicarbonate and also its regression coefficient showed significant potential to be predicted by venous HCO3 (r = 0.984, P < 0.01) through the following regression model:
2. ABG. HCO3 = (0.992 × VBG.HCO3) – 2.0384
The great ability of the model to predict arterial HCO3 is inferred from its high coefficient of determination measured for this model (R2 linear = 0.9698) which is indicative of good repeatability and determination in patients admitted to the ICU. Measured parameters of regression model of arterial pH and also its regression coefficient showed significant potential to be predicted by venous pH (r = 0.9766, P < 0.01) through the following regression model:
3. ABG. pH = (0.914 × VBG pH) + 0.656
The great ability of the model to predict arterial pH is inferred from its high coefficient of determination measured for this model (R2 linear = 0.9538) which is indicative of good repeatability and determination in patients admitted to the ICU. We assessed the parameters of the regression models of arterial PO2 and used them to design predictive regression equations. For these blood gas factors, poor coefficients of determination (0.0105) were measured which were indicative of weak repeatability of the models (R2 linear = 0.0103) to predict arterial PO2. The designed regression models are as follows:
4. ABG.PO2 = (0.1279 × VBG.PO2) + 90.57
This model for predicting PO2 ABG value (Y) knowing PO2 VBG value (X) is not useful as the model fails to explain 98% of the observed variation in the data.
The present study demonstrated that VBG values especially pCO2, HCO3 (bicarbonate) and pH levels have relatively good correlation with ABG values. Because this correlation was close (r > 0.9), VBG can be a substitute for ABG in ICU patients with some considerable limitations. Considering the ease of venous blood sample collection, it would be preferred over arterial sampling if a blood gas value determined by VBG analysis could be used to reveal patient’s acid–base status and had the same accuracy for patient management as that of arterial sampling. In this regard, various studies have been reported on children and adults to investigate the accuracy and efficacy of VBG analysis versus ABG.[5,6,11-16] In a study carried out by Kelly, the venous and arterial pH showed a high degree of correlation (r = 0.92) and with an average difference between the samples of −0.04 units.[13] In the present study, the venous and arterial pH showed a high degree of correlation (r = 0.90) and with an average difference between the samples of 0.03 ± 0.20 which is correlated with the other studies.[11,13,17]
There are some limitations of the study which include – this was a single centre study included specific population like all were from ICU set-up. Hence, ward/OPD/casualty patients were not considered. We have taken one ABG and VBG sample per patient, which may not be sufficient to conclude, because there can occur errors in sampling, transportation or analysis through ABG machine analyser.
CONCLUSION
ABG analysis and VBG analysis correlated well for pCO2, pH, and HCO3 (bicarbonate), however there is poor correlation in PO2. The results show that VBG analysis can be a substitute for ABG for evaluation of ventilatory function and acid–base imbalance for pH, pCO2 and HCO3 (bicarbonate) in patients of ICU set up in many clinical contexts. Moreover, VBG can be used to assess ABG values, where arterial puncture is contraindicated or difficult; however, VBG should be coupled with pulse oximetry since PO2 in VBG does not correlate with PO2 of ABG.
Declaration of patient consent
The authors certify that they have obtained all appropriate patient consent.
Conflicts of interest
There are no conflicts of interest.
Financial support and sponsorship
Nil.
References
- Acid base analysis In: The ICU Book (4th ed). Ch. 31. United States: Lippincott Williams and Wilkins; 2014. p. :587-600.
- [Google Scholar]
- Arterial puncture and cannulation In: Roberts JR, Hedges JR, eds. Clinical Procedures in Emergency Medicine (3rd ed). Philadelphia, PA: WB Saunders; 1998. p. :308-22.
- [Google Scholar]
- Prediction of arterial blood gas values from arterialized earlobe blood gas values in patients treated with mechanical ventilation. Indian J Crit Care Med. 2008;12:96-101.
- [CrossRef] [PubMed] [Google Scholar]
- Correlation between acid-base parameters measured in arterial blood and venous blood sampled peripherally, from vena cava superior, and from the pulmonary artery. Eur J Emerg Med. 2008;15:86-91.
- [CrossRef] [PubMed] [Google Scholar]
- Comparison of arterial and venous pH, bicarbonate, PCO2 and PO2 in initial emergency department assessment. Emerg Med J. 2007;24:569-71.
- [CrossRef] [PubMed] [Google Scholar]
- Correlation of central venous and arterial blood gas measurements in mechanically ventilated trauma patients. Arch Surg. 2005;140:1122-5.
- [CrossRef] [PubMed] [Google Scholar]
- Prediction of arterial blood gas factors from venous blood gas factors in intensive care unit admitted patients. Arch Iran Med. 2018;21:246-50.
- [Google Scholar]
- Can peripheral venous blood gases replace arterial blood gases in emergency department patients? CJEM. 2002;4:7-15.
- [CrossRef] [PubMed] [Google Scholar]
- Comparison of arterial and venous blood gases analysis in patients with exacerbation of chronic obstructive pulmonary disease. Saudi Med J. 2007;28:862-5.
- [Google Scholar]
- Correlation between peripheral venous and arterial blood gas measurements in patients admitted to the intensive care unit: A single-centre study. Kidney Res Clin Pract. 2013;32:32-8.
- [CrossRef] [PubMed] [Google Scholar]
- The usefulness of peripheral venous blood in estimating acid-base status in acutely ill patients. Ann Emerg Med. 1985;14:845-9.
- [CrossRef] [PubMed] [Google Scholar]
- Correlation of simultaneously obtained capillary, venous, and arterial blood gases of patients in a paediatric intensive care unit. Arch Dis Child. 2004;89:176-80.
- [CrossRef] [PubMed] [Google Scholar]
- The case for venous rather than arterial blood gases in diabetic ketoacidosis. Emerg Med Australas. 2006;18:64-7.
- [CrossRef] [PubMed] [Google Scholar]
- Arterial blood gas results rarely influence emergency physician management of patients with suspected diabetic ketoacidosis. Acad Emerg Med. 2003;10:836-41.
- [CrossRef] [Google Scholar]
- Comparison of simultaneously obtained arterial and capillary blood gases in pediatric intensive care unit patients. Crit Care Med. 1997;25:1904-8.
- [CrossRef] [PubMed] [Google Scholar]
- Correlation of venous and arterial blood gas values following cardiothoracic surgery in infants and children. J Intensive Care Med. 2001;16:231-5.
- [CrossRef] [Google Scholar]
- Comparison of blood gas and acid-base measurements in arterial and venous blood samples in patients with uremic acidosis and diabetic ketoacidosis in the emergency room. Am J Nephrol. 2000;20:319-23.
- [CrossRef] [PubMed] [Google Scholar]